
Your ticketing system is already deciding next month’s revenue.
You just can’t see the number yet.
That’s what changes when ticketing efficiency becomes visible.
The Proof
What happens when ticketing blind spots are finally exposed.
✅ 614% revenue growth in 12 months
The same audience. The same demand.
Radically different revenue.
Sales Efficiency: Industry Average vs. WSO Theaters
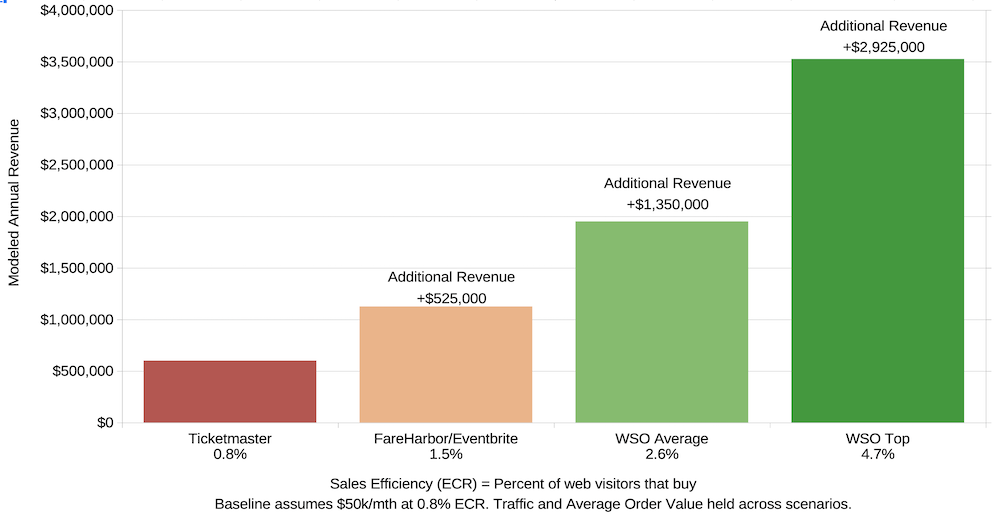
The separation begins when operators can finally see where revenue disappears.
The Cost of Waiting
Most theaters don’t fail. They stall.
Revenue holds steady. Ads get more expensive. Margins quietly compress.
The dangerous part? Nothing looks broken.
But efficiency gaps don’t stay flat. They compound.
Every month on an inefficient system:
• More demand is lost before checkout
• More abandoned buyers are lost permanently
• More data feeds competitors who already optimized
Leaders don’t pull ahead by moving faster. They pull ahead by fixing structural inefficiency first.
Standing still is not neutral.
Case Studies
Same engine. Different markets.
Different ceilings.
Also deployed in San Francisco and Washington DC.
The Advantage
This advantage strengthens every month.
Once a theater operates with higher efficiency, every decision compounds. More data sharpens the system. More volume widens the gap.
This is why leaders pull away while others stay busy.
This gap is structural, not tactical.
See Where Your System Actually Sits
Guessing is for operators. Leaders measure.
Spotlight reveals the efficiency number your system is already producing.
A diagnostic snapshot. Not a platform change.
Already clear on your numbers?Talk it through.
Data verified from live WSO theaters. Figures are verified from tracked ticket sales and reviewed quarterly for accuracy. Results vary by market and execution, but efficiency always compounds.